Difference between revisions of "Monitoring Resource Usage of Jobs with cAdvisor"
(→Building cAdvisor) |
|||
| (10 intermediate revisions by one user not shown) | |||
| Line 4: | Line 4: | ||
More information is available here: https://github.com/google/cadvisor | More information is available here: https://github.com/google/cadvisor | ||
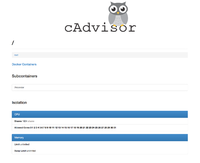
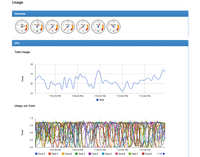
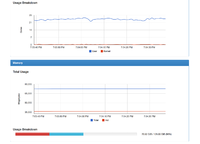
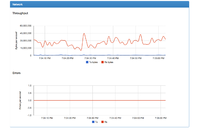
| − | The main page of the UI shows an overview of CPU, memory, network and disk usage of the whole node | + | The main page of the UI shows an overview of CPU, memory, network and disk usage of the whole node (the single page is split into 5 images below for an example worker node): |
{|border="1",cellpadding="1" | {|border="1",cellpadding="1" | ||
|-style="background:white;color:white" | |-style="background:white;color:white" | ||
| Line 22: | Line 22: | ||
Clicking on one of the listed jobs gives information about the resource usage of that job. | Clicking on one of the listed jobs gives information about the resource usage of that job. | ||
| − | The web UI is of limited use as it only shows data over the past minute. Using Grafana for visualizing data collected by cAdvisor and stored in InfluxDB is more | + | The web UI is of limited use as it only shows data over the past minute. Using Grafana for visualizing data collected by cAdvisor and stored in InfluxDB is more useful. Alternatively, it should be possible for cAdvisor to send data to ElasticSearch eventually https://github.com/google/cadvisor/issues/634. |
== Building cAdvisor == | == Building cAdvisor == | ||
| + | A machine with go installed is required. To prepare such an environment on SL6: | ||
| + | yum -y install git | ||
| + | yum -y install go | ||
| + | rpm -ivh http://mercurial.selenic.com/release/centos6/RPMS/x86_64/mercurial-3.4-0.x86_64.rpm | ||
| + | mkdir /var/lib/go | ||
| + | export GOPATH=/var/lib/go | ||
| + | Then | ||
| + | go get -d github.com/google/cadvisor | ||
| + | go get github.com/tools/godep | ||
| + | cd $GOPATH/src/github.com/google/cadvisor | ||
| + | $GOPATH/bin/godep go build | ||
| + | In the current directory the executable ''cadvisor'' will be created. It has no dependencies and can therefore be placed on any machines as necessary which need to be monitored. | ||
| − | == | + | == Installing & configuring InfluxDB == |
| − | + | It's very easy to install a single-node InfluxDB instance. Download and install the rpm: | |
| − | + | ||
| − | + | ||
| − | + | ||
| − | + | ||
| − | + | ||
| − | + | ||
| − | Download and install the rpm: | + | |
wget https://s3.amazonaws.com/influxdb/influxdb-latest-1.x86_64.rpm | wget https://s3.amazonaws.com/influxdb/influxdb-latest-1.x86_64.rpm | ||
rpm -ivh influxdb-latest-1.x86_64.rpm | rpm -ivh influxdb-latest-1.x86_64.rpm | ||
| Line 50: | Line 55: | ||
More information available at http://influxdb.com | More information available at http://influxdb.com | ||
| + | |||
| + | == Running cAdvisor == | ||
| + | Example usage on a worker node | ||
| + | /usr/local/bin/cadvisor -storage_driver=influxdb -storage_driver_host=hostname:8086 -storage_driver_db=database_name \ | ||
| + | -storage_driver_password=password -storage_driver_user=user -storage_driver_secure=false -storage_driver_table=stats | ||
| + | where the InfluxDB hostname, database name, username and password should be changed as appropriate. | ||
| + | |||
== Installing Grafana == | == Installing Grafana == | ||
| Line 56: | Line 68: | ||
and start the service | and start the service | ||
service grafana-server start | service grafana-server start | ||
| + | The web UI should be visible at http://hostname:3000. | ||
| + | |||
| + | == Configurating Grafana == | ||
| + | After logging in (the default username and password are admin/admin), follow the instructions http://docs.grafana.org/datasources/influxdb/ in order to add the InfluxDB as a data source. | ||
| + | {|border="1",cellpadding="1" | ||
| + | |-style="background:white;color:white" | ||
| + | |[[File:Grafana1.png|200px|thumb]] | ||
| + | |} | ||
Latest revision as of 20:09, 12 May 2015
Contents
Introduction
Google's cAdvisor (Container Advisor) provides information about the resources used by containers. A web UI is exposed at http://hostname:port/, and in addition data is exported to a central database. For sites running a batch system with cgroups enabled, cAdvisor can provide information about running jobs on worker nodes.
More information is available here: https://github.com/google/cadvisor
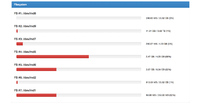
The main page of the UI shows an overview of CPU, memory, network and disk usage of the whole node (the single page is split into 5 images below for an example worker node):
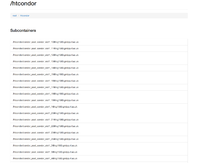
You can then drill down and view information about individual jobs.
Clicking on one of the listed jobs gives information about the resource usage of that job.
The web UI is of limited use as it only shows data over the past minute. Using Grafana for visualizing data collected by cAdvisor and stored in InfluxDB is more useful. Alternatively, it should be possible for cAdvisor to send data to ElasticSearch eventually https://github.com/google/cadvisor/issues/634.
Building cAdvisor
A machine with go installed is required. To prepare such an environment on SL6:
yum -y install git
yum -y install go
rpm -ivh http://mercurial.selenic.com/release/centos6/RPMS/x86_64/mercurial-3.4-0.x86_64.rpm
mkdir /var/lib/go
export GOPATH=/var/lib/go
Then
go get -d github.com/google/cadvisor
go get github.com/tools/godep
cd $GOPATH/src/github.com/google/cadvisor
$GOPATH/bin/godep go build
In the current directory the executable cadvisor will be created. It has no dependencies and can therefore be placed on any machines as necessary which need to be monitored.
Installing & configuring InfluxDB
It's very easy to install a single-node InfluxDB instance. Download and install the rpm:
wget https://s3.amazonaws.com/influxdb/influxdb-latest-1.x86_64.rpm
rpm -ivh influxdb-latest-1.x86_64.rpm
then start the service
service influxdb start
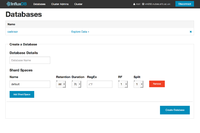
In a browser go to http://hostname:8083/ and login using the default username (root) and password (root). To create a database for cAdvisor, specify a database name in the 'Database Details' part of 'Create a Database' and click 'Create Database'.
You should see something like the following:
Once the database has been created, click on the database name and create a user by specifying the username and password in the 'Create a New Database User' section.
More information available at http://influxdb.com
Running cAdvisor
Example usage on a worker node
/usr/local/bin/cadvisor -storage_driver=influxdb -storage_driver_host=hostname:8086 -storage_driver_db=database_name \
-storage_driver_password=password -storage_driver_user=user -storage_driver_secure=false -storage_driver_table=stats
where the InfluxDB hostname, database name, username and password should be changed as appropriate.
Installing Grafana
Download and install the rpm:
rpm -ivh https://grafanarel.s3.amazonaws.com/builds/grafana-2.0.2-1.x86_64.rpm
and start the service
service grafana-server start
The web UI should be visible at http://hostname:3000.
Configurating Grafana
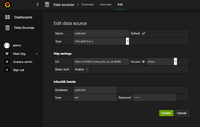
After logging in (the default username and password are admin/admin), follow the instructions http://docs.grafana.org/datasources/influxdb/ in order to add the InfluxDB as a data source.
